Food is something that we all understand. Everyone needs to eat, everyone needs to drink, and everyone needs sustenance in order to survive. Data is a lot like food, everyone needs it (even if you don’t think so). If you don’t agree with this, use banking and finance as good examples. Imagine going into a store and not knowing if you can afford something, either you would pass it up even though you have the money or you would buy it and get rejected because you don’t have enough. In this article, I will outline different levels of data literacy in the context of food!
Daily Diner
Maybe you are a daily diner, the type of person that eats to live and nothing more. This person likes peanut butter and jelly sandwiches, maybe they go out to a restaurant now and again, but generally speaking, are not very adventurous. The daily diner eats for the purposes of sustaining life but not for making the most of it, enjoying it, or using food to make their life better. When it comes to data, this person may be aware of their financial standing (online banking, etc.).
If you’re at the daily diner level of data, you likely use data to understand what’s happening. What you should consider is how you can use data to make things better. Ask not only “is this good, bad, or otherwise?”, but next “how can I use this data to make things better?”. Another consideration the daily data diner needs to consider is what more information is needed. These will all help in moving forward in data and improving data comfort and literacy.
Nutritiously Nourished
There are other types of diners too, the nutritiously nourished diner thinks about the calories and nutritional value of their food. They food combine and research what’s good for them. They are thinking about how their food can help them get a better quality of life. In data there are those like this too, they may not be into fancy graphs and data visualizations, but they want to know what they need to know to get healthier/better. This person relies on good quality and reliable data to make their decisions in life. They may not be that adventurous and that is not bad, however, there are definitely opportunities to be better.
If you are nutritiously nourished with data, consider how your data should be more visually appealing. This is not for the purposes of making things “pretty” as much as it is adding value by providing better and easier visual comparisons to make faster judgments and decisions.
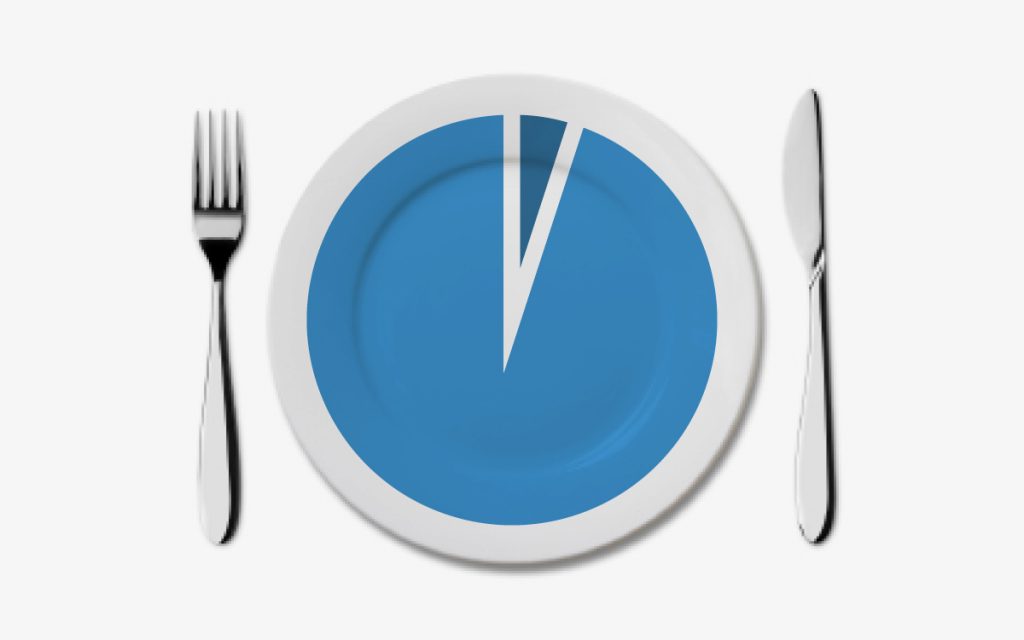
Fabulous Foodie
Everyone knows this type of person, they are constantly pulling out their phone at restaurants. They insist on taking a dozen photos of their food before eating it (and may not even take a bite!). This person cares only about how it looks and how it would work on “the gram”. In data, we have this type of person too! They look at a report, a chart, or a graph and always complain that it’s not pretty enough. They want the colours to be “matchy-matchy” and to have a theme and a style. This person, however, doesn’t use data to its maximum and cares more that it looks good than it tells a good story.
If you are a fabulous foodie type, consider looking for the colours to mean something. This can be as simple as RAG (red, amber, green) as a scale from bad to good. This can be more complex like shades of colour from light to dark representing degrees of attainment. Be careful also not to allow things like 3D graphs to be nothing but visual trickery but to add a 3rd dimension of the data (e.g. a 3D pie chart where the size of the slice is the proportion and the height of the slice represents the absolute value).
Line Cook
The line cook shifts away from being a consumer and toward being a creator. The line cook contributes to putting dishes onto plates and getting people the food that they need. This person, however, is focused on doing the work and getting things done quickly. They are not planning the menu or thinking of the big vision. If you’re a line-cook of data you may even be in an analyst role. You know where the data comes from and you know how to ETL and put it on a page, but there’s more to this story.
If you’re the line cook start considering the following questions “what will my stakeholder DO with this data?” and “how can this improve their lives?”. Many stakeholders have an idea as to what they want but don’t know what’s available or how to get there. As the line cook, step out and try to help your consumers know what they can ask for and assist in their data journey by offering ways to make the data more accessible and useful.
Head Chef and the Careful Connoisseur
As with food everyone plays a role and is necessary. Whether you’re a line cook, a daily diner, or a fabulous foodie, you have a part to play. There are, however, two roles that one could consider the top of the pyramid. These two roles are the head chef and the careful connoisseur. These two roles indicate an ultimate progression in data and are necessary. They may not always get along because both roles often have unique and differing visions for how things should be done but they are both necessary in driving a data culture. The head chef has a vision for where data should be going, he or she has a goal for the destination that the consumers will be and how to get there. The head chef also has the skills necessary to present the whole picture in a manner that individuals can and should consume. A careful connoisseur is a person on the receiving end of this with high levels of scrutiny and expectation. A careful connoisseur also has a vision for how he or she will receive the data, what they will do with the data, how they should interact with the data, and what it should look like (both from a visual standpoint and what the data values should be). Together, however, these two roles help organizations get better.
There are other roles like farmers (who gather, collect, and process data), distributors (those that make data available and transport it), as well as others. These roles fit into a different article, one that will come at a later date. Take a moment to consider where you are in your data journey and which of these roles might suit you best and see how you can get to the next step in your journey. I would welcome questions, comments, and challenges and look forward to a further conversation.